Tracking Data Visualization
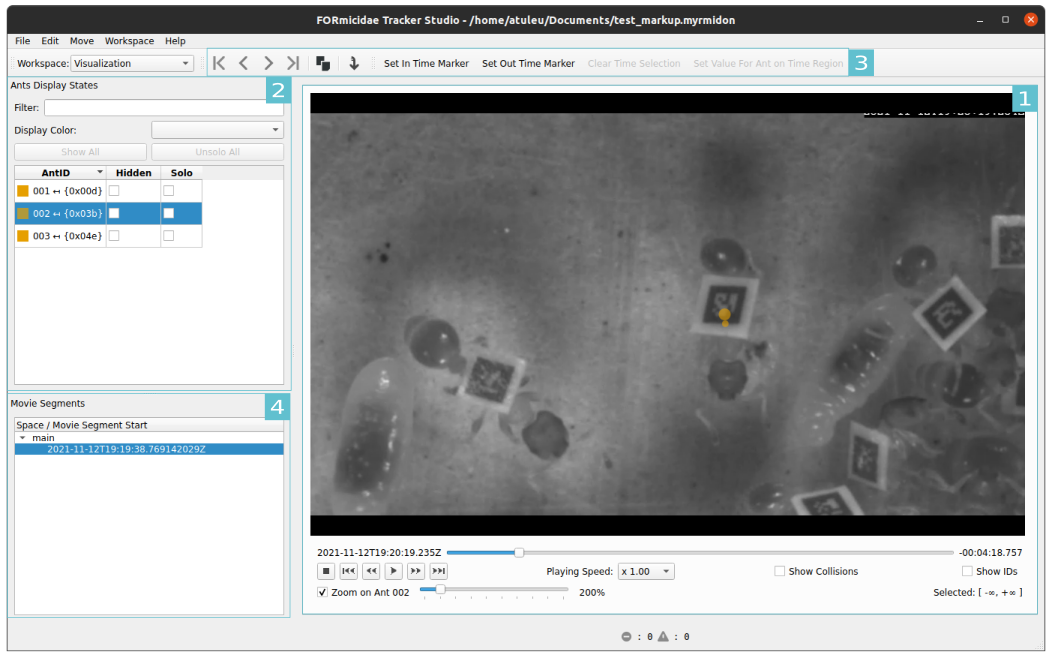
Fig. 7 fort-studio Visualization workspace
[1]: The Video Player displays video frames with overlaid tracking information [2]: Ant Displays States allows selecting which and how Ant are displayed. [3]: The Marking Toolbar allows the efficient edition of Ant metadata from the visualization workspace. [4]: The Movie Segment List shows available movie segment.
The Visualization workspace allows the visualization of the tracking data during the Experiment. By default, the FORT system saves video in chunk of two hours. These Video Segment can be selected in the Movie Segment List.
Alternatively, the Move>Jump to Time action can be used to go
to a specific time.
The video scrollbar can be used to rapidly scroll through the segment. Alternatively keyboard shortcuts could be used to move forward backward (they use no modifiers).
J/L: jump 10 second backward / forwardShift+J/Shift+L: jump 1 minute backward / forwardCtrl+Shift+J/Ctrl+Shift+L: jump 10 minutes backward / forward,/: jump one video frame backward / forwardH/;: jump to the previous / next time selected ant is visible
Setting Metadata during Visualization
The Visualization workspace can be used to efficiently enter metadata for an Ant:
Select the Ant we want to assign a key / value
Select a time window to set a value on. Using
Set In Marker/Set Out Marker(shortcut:I/O) we can choose the current video frame ad the beginning or the end of this time range.Use the
Set Value For Ant on Time Region(shortcut:Ctrl+K), a popup window will appear to allow to select a key and value to set.
Note
Keys must be previously defined in the Ant Metadata workspace.